Open a pressure sensor datasheet and you will see accuracy figures like ±0.5% FS on one page and ±0.1% FS on the next. Most engineers compare the two numbers and stop there.
That number is a summary. It hides three separate errors, and they behave very differently. One of them you can remove with software. The other two you cannot.
This article breaks down what static accuracy measures, how the three errors are defined, and how to read a datasheet without being misled.
What %FS Means — and Why It Is Not % of Reading
This is the most misread line on any datasheet.
FS means full scale. The error is a percentage of the sensor’s rated range, not of the pressure you are measuring.
A worked example. A 10 MPa sensor with 0.05% FS accuracy:
0.05% × 10 MPa = ±0.005 MPa
That is ±5 kPa across the whole range. At 10 MPa the error is negligible. At 1 MPa it is 0.5% of reading. At 0.2 MPa it is 2.5% of reading.
Here is the trap. If your process only uses the bottom 10% of the rated range, your real error is ten times worse than the datasheet suggests.
The fix is simple. Choose a range close to your actual working pressure. Oversizing the range to “be safe” costs you accuracy you already paid for.
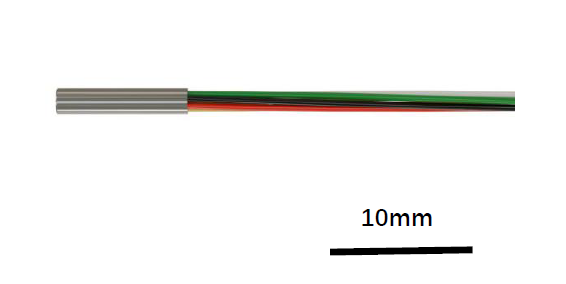
For a step-by-step method, see our Ultraminiature Pressure Transducer Selection Guide.
Error 1: Non-linearity — BFSL vs Terminal Point Method
Ideal behaviour is a straight line. Pressure goes up, output goes up in proportion.
Real behaviour bends. The largest gap between the actual curve and a reference straight line is the non-linearity error.
Two reference lines, two different numbers
The industry uses two baselines:
- Best fit straight line (BFSL) — a least-squares line drawn through the measured data. Gives the smaller number.
- Terminal point method — a line drawn between zero and full scale. Gives the larger number.
Same sensor. Same test. Two different specifications. Always check which method a datasheet uses before you put two of them side by side.
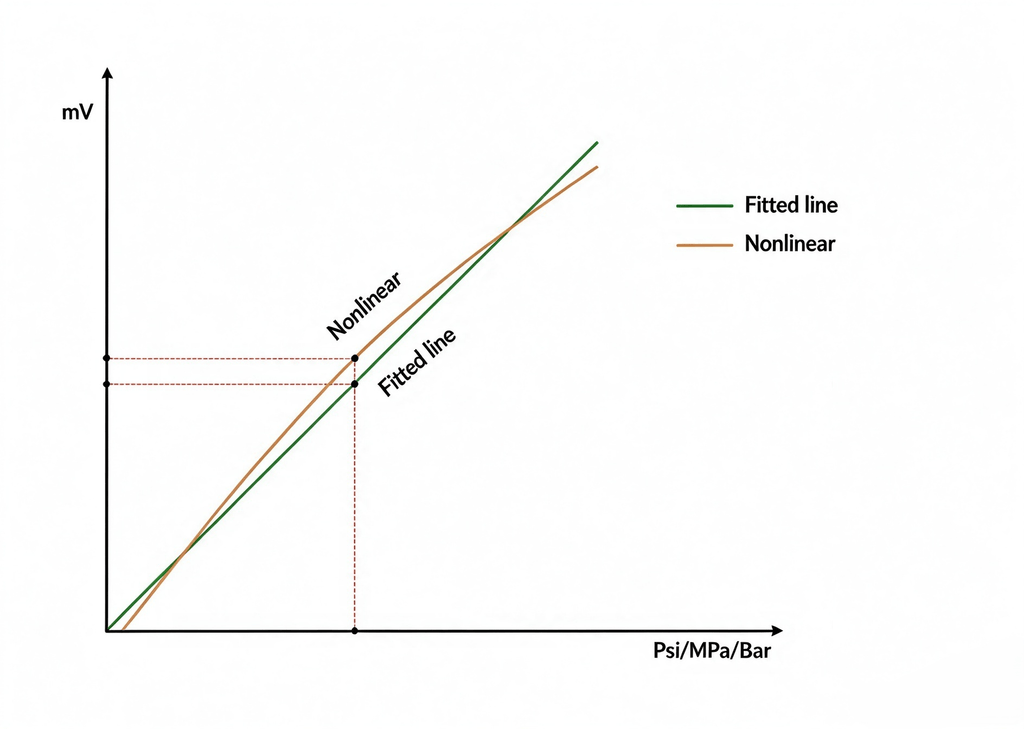

Figure 1 — Non-linearity against two reference lines. The same measured curve produces two different figures, depending on which baseline is used.
What causes it
- Physical properties of the sensing material
- Structural stress and strain
- Residual stress from the packaging process
How it is corrected
Non-linearity is repeatable. The same pressure produces the same error every time. That makes it correctable:
- 3rd or 5th order polynomial correction
- Piecewise linear correction
- Lookup table interpolation
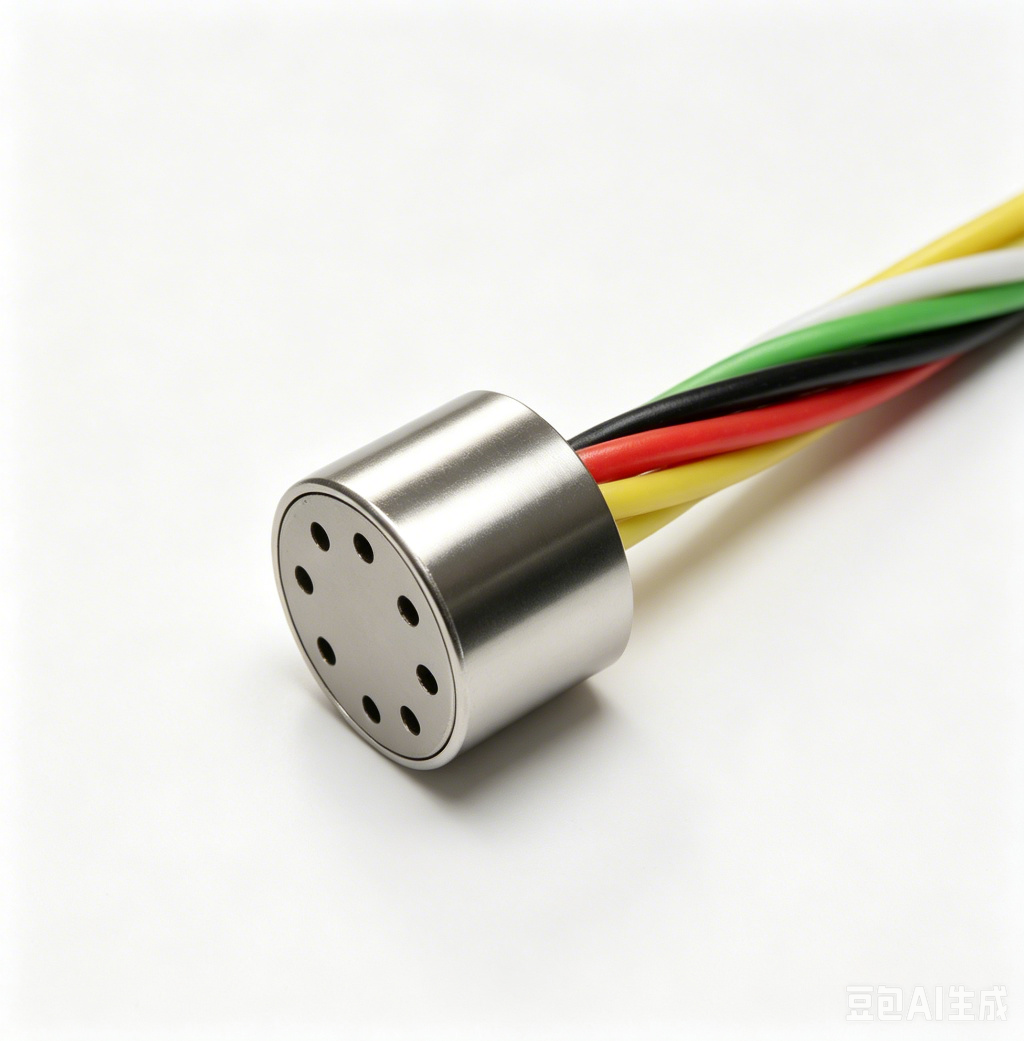
On a digitally compensated sensor, this happens inside the unit. Our MPTW100 high-frequency pressure sensor does this on board, which is why its non-linearity figure stays low across the full range.
Error 2: Hysteresis — Why Rising and Falling Pressure Read Differently
Apply pressure. Then release it. At the same pressure point, the output reads differently in the two directions. That gap is hysteresis.


Figure 2 — Hysteresis loop. The gap between the two curves at the same pressure point is the hysteresis error.
It matters most in hydraulic systems, bidirectional pressure control, and anything that cycles. Severe hysteresis causes control oscillation. The loop keeps correcting for an error that is not there.
Causes:
- Lattice hysteresis in the elastic material
- Internal mechanical friction between parts
- Lag in the strain response when pressure reverses
Correction: you can reduce it, not remove it.
Better diaphragm material, cleaner structural design, less internal friction. That is the whole toolkit.
Error 3: Repeatability — Is It the Same as Accuracy?
Repeatability is the spread of readings when you measure the same pressure, in the same conditions, again and again.
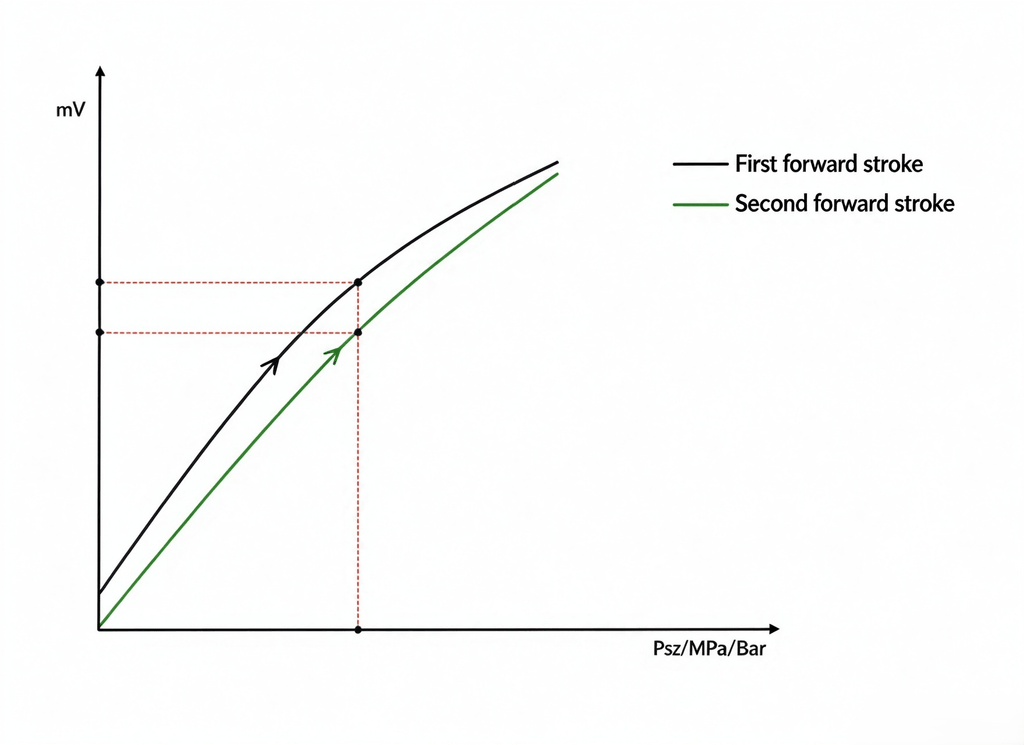

Figure 3 — Repeatability. Five consecutive cycles at the same conditions. The spread at each pressure point is the repeatability error.
Two definitions worth keeping apart:
- Accuracy — how close the reading is to the true pressure
- Repeatability — how consistent the sensor is with itself
A sensor can be highly repeatable and still inaccurate. If it is always offset by the same amount, it is consistent but wrong. But a genuinely high-accuracy sensor always has good repeatability. The reverse is not true.
Sources of noise:
- Creep and relaxation in the structure
- Circuit noise
- Micro-slip between parts
- Vibration in the environment
Which Errors Can Be Fixed, and Which Cannot
This table is the part worth remembering.
| Error | Repeatable? | Correctable in software? |
|---|---|---|
| Non-linearity | Yes | Yes |
| Hysteresis | No | No |
| Repeatability | No | No |
Non-linearity behaves the same way every time. A correction curve removes it.
Hysteresis depends on direction. Repeatability depends on chance. Neither can be corrected after the sensor is built. They have to be solved in the design — material, structure, and circuit.
This is why two sensors with the same stated accuracy can perform very differently in the field. If most of the error budget sits in non-linearity, software handles it. If it sits in hysteresis, nothing does.
When you compare suppliers, ask for the three figures separately. A single combined number hides which error dominates — and that is exactly what you need to know. Our cross-reference library lists these figures side by side for common equivalent models.
Pressure Sensor Accuracy Classes
| Class | Typical range | Where it fits |
|---|---|---|
| Standard | ±0.5% to ±1% FS | General industrial lines, routine fluid monitoring |
| Precision | ±0.2% to ±0.5% FS | Small and medium hydraulic equipment, general test rigs |
| High precision | ±0.02% to ±0.2% FS | Aerospace pressure measurement, laboratory calibration, high-end medical |
How to choose: enough is enough. Higher accuracy costs more, and it usually demands a better DAQ and better calibration equipment before you can even see the difference. If your measurement chain cannot resolve 0.05% FS, buying it is wasted money.
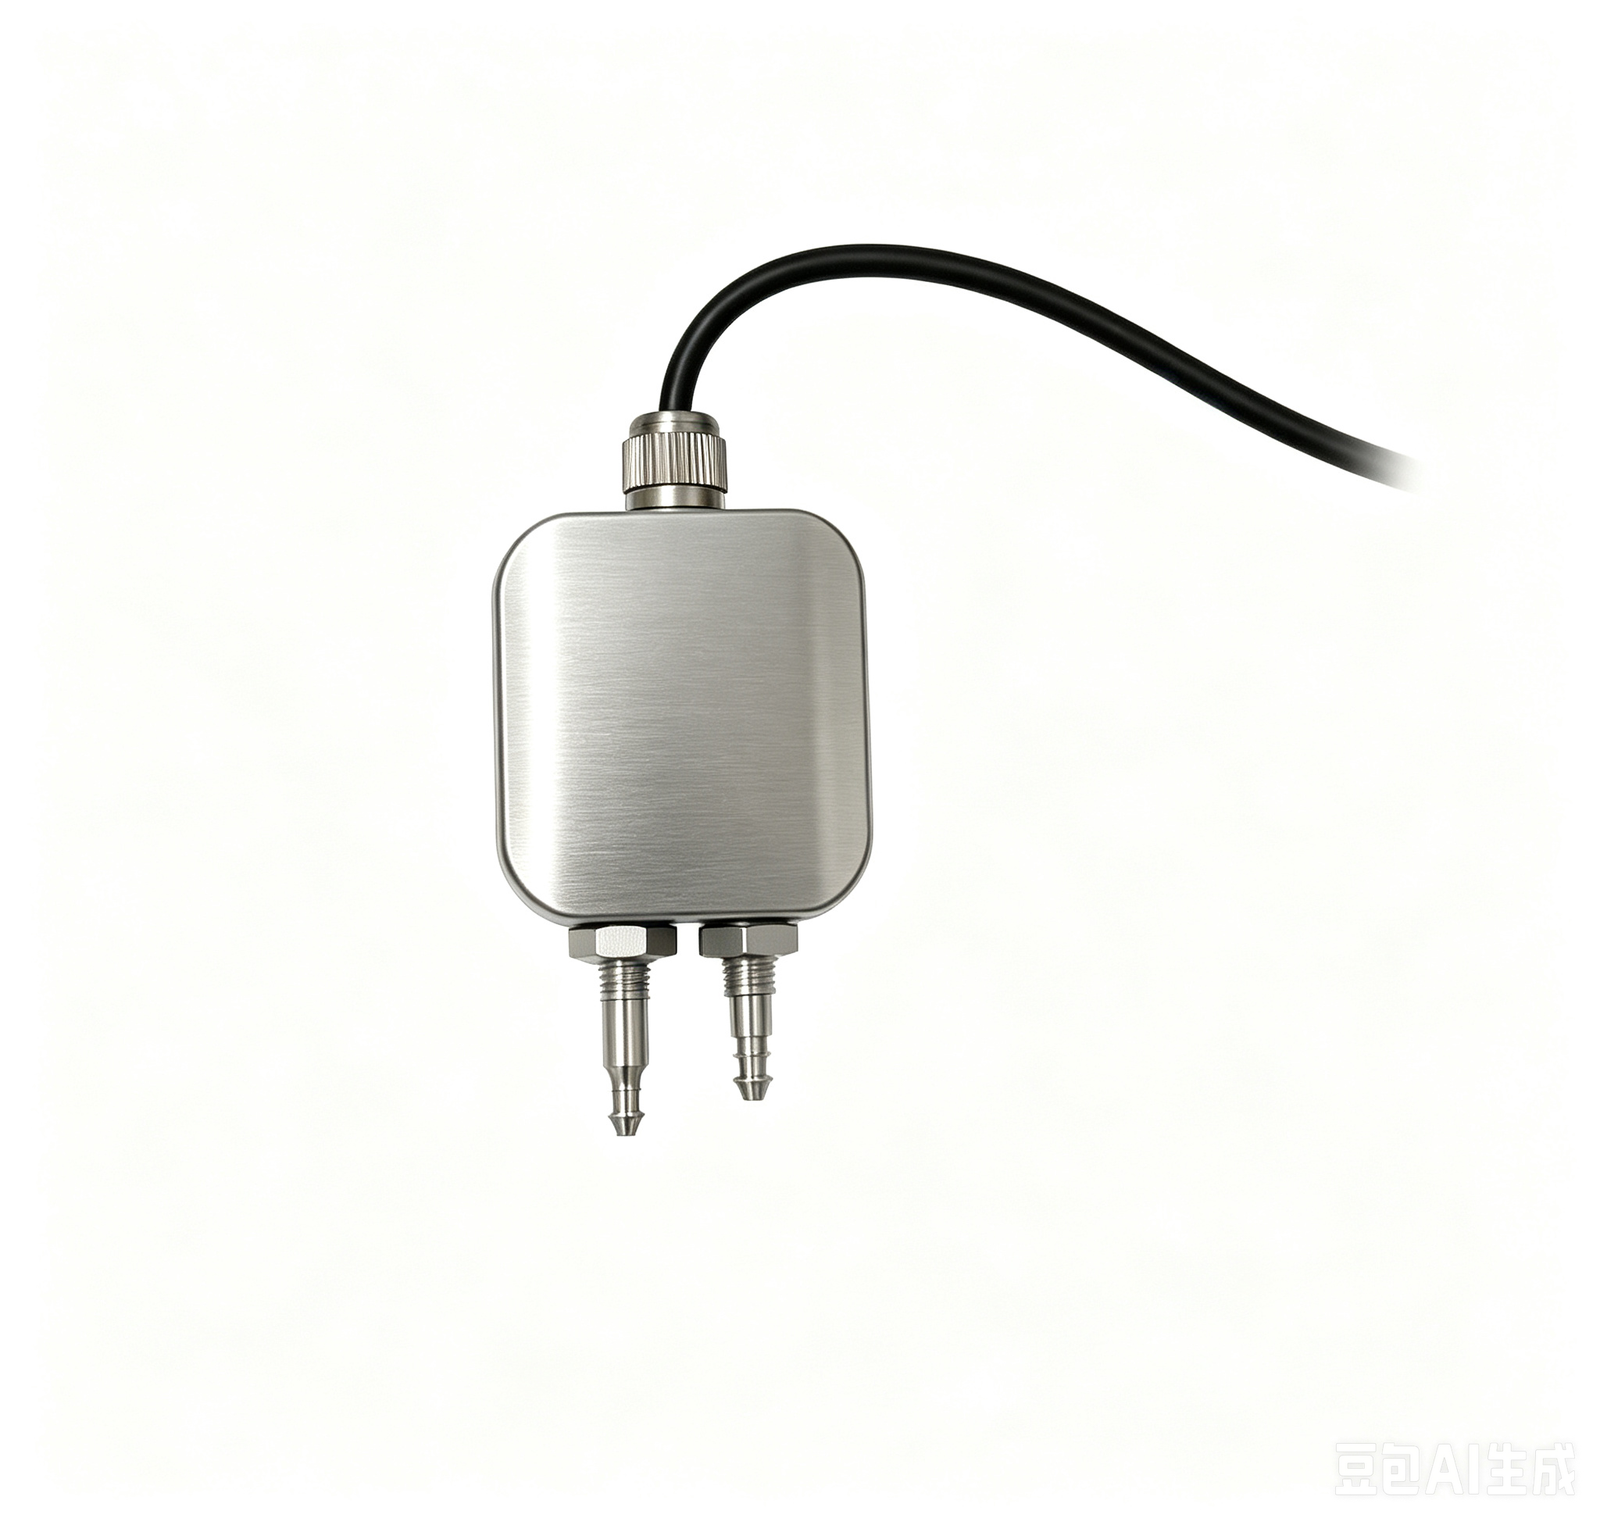
DABEY accuracy codes are A1 = 0.2% FS and A2 = 0.1% FS, both specified against the best fit straight line. Tighter classes are available on request. A typical high-precision option is the MPTW500 miniature pressure transducer.
The Test Equipment Is Part of the Measurement
A 0.05% FS sensor measured against a 0.1% FS reference is not a 0.05% measurement. The reference becomes the limit.
Rule of thumb: the calibration reference should be three to four times more accurate than the sensor under test. Below that ratio, you are measuring your test bench, not your sensor.
This is also why a test report should state which reference equipment was used. If a supplier quotes a figure without saying how it was measured, treat the number as indicative.
Measured Performance: MPT500-S4, 0–10 MPa
Catalog accuracy figures are limits. They guarantee a worst case across every unit shipped. A test report on a single unit usually shows something better.
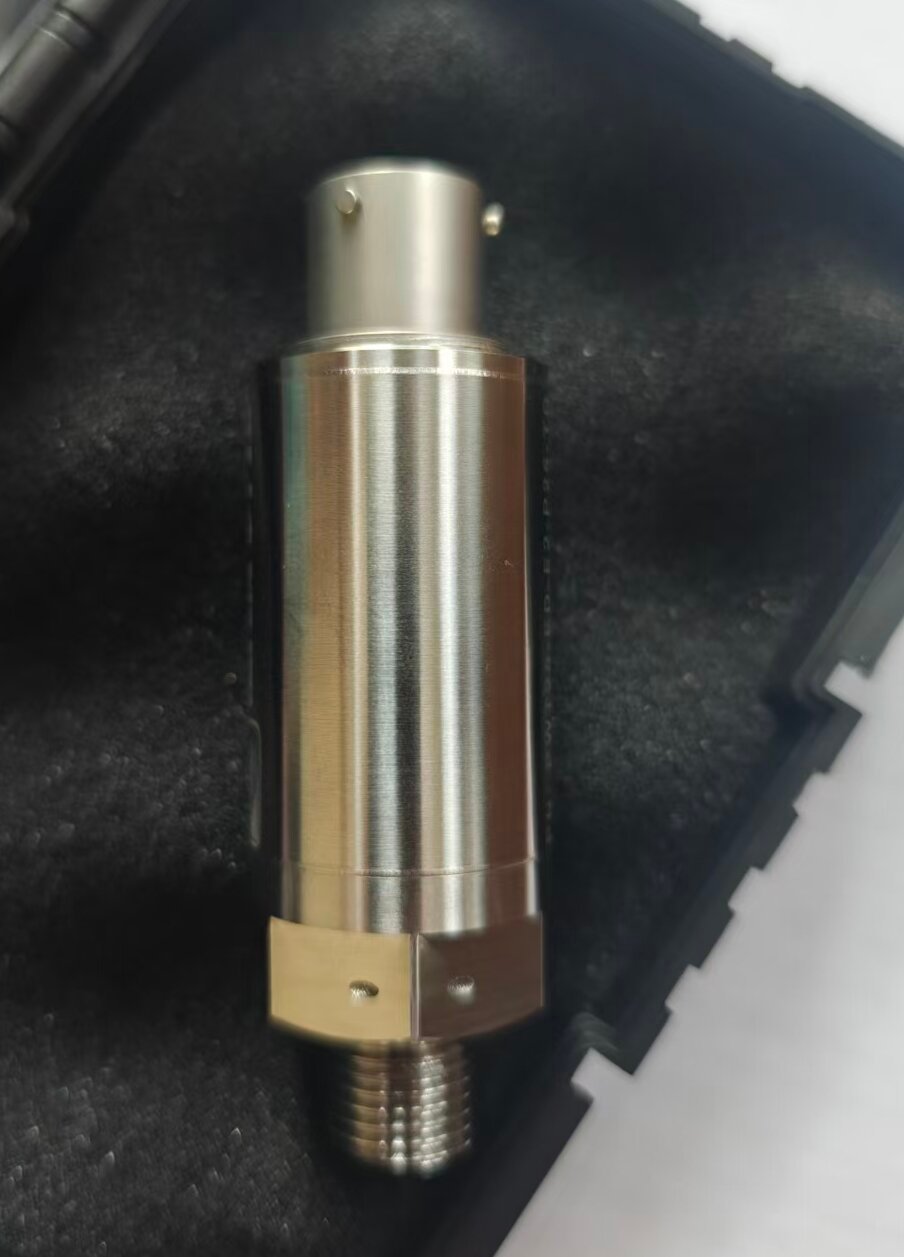
The figures below come from a cycling test on a DABEY MPT500-S4, 0–10 MPa range, S4 output:
| Error | Measured |
|---|---|
| Non-linearity | 0.04% FS |
| Hysteresis | 0.02% FS |
| Repeatability | 0.01% FS |
| Combined | 0.05% FS |

Figure 4 — Cycling test results, DABEY MPT500-S4, 0–10 MPa range, S4 output.
How the combined figure is calculated
The three errors are not added together. Simple addition would give 0.07% FS, which overstates the real error. The three do not peak at the same pressure point.
They combine by root sum square:
√(0.04² + 0.02² + 0.01²) = 0.046% FS
Rounded to 0.05% FS.
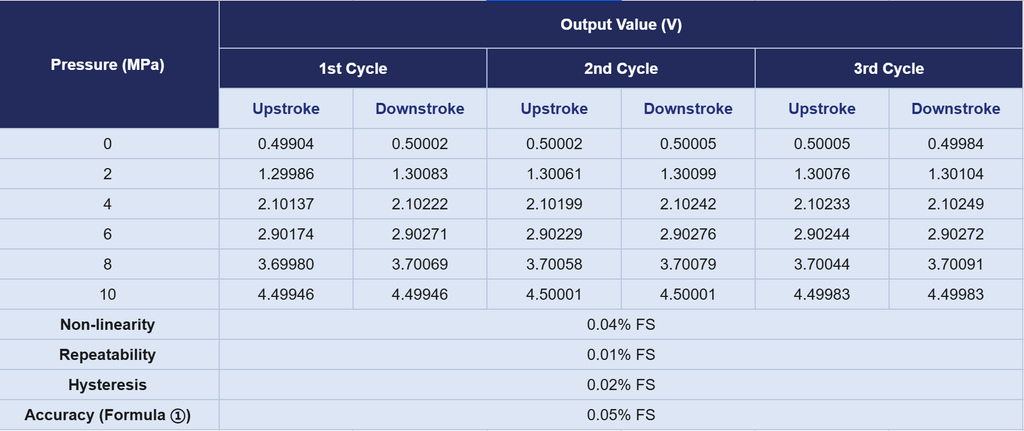

Figure 5 — Error budget. The three errors combine by root sum square, not by simple addition.
Why the non-linearity figure is low
The S4 output includes digital compensation. Non-linearity is repeatable, so it can be corrected inside the unit. Of the three errors, this is the one that responds to software.
Hysteresis and repeatability do not. Their figures come from the diaphragm material and the mechanical structure. What you see is what the design delivers.
A note on the numbers
The measured combined error of 0.05% FS is tighter than the A2 catalog class of 0.1% FS BFSL. That is expected. The catalog figure is a guaranteed limit for every unit. The test report describes one unit under stated conditions. It shows what the design can do, not a guaranteed value for every shipment.
FAQ
What does %FS mean on a pressure sensor datasheet?
FS stands for full scale. The error is a percentage of the sensor’s rated range, not of the reading. At low pressures, the same sensor can show a much larger error as a percentage of reading.
What is the difference between BFSL and terminal point non-linearity?
BFSL uses a least-squares line through the measured data. The terminal point method uses a line drawn between zero and full scale. BFSL usually produces the smaller figure, so the two are not comparable unless the method is stated.
Can non-linearity be corrected?
Yes. Non-linearity is repeatable, so it can be removed with polynomial correction, piecewise linear correction, or a lookup table. Digitally compensated sensors do this internally.
Can hysteresis be corrected?
No. Hysteresis depends on the direction of pressure change, so it cannot be corrected after manufacture. It has to be reduced by material and structural design.
Why does my pressure sensor read differently going up and down?
Because of hysteresis. The elastic material and internal friction cause the output to lag when pressure reverses. The gap between the rising and falling curves is the hysteresis error. It cannot be corrected in software — it has to be reduced in the design.
Is repeatability the same as accuracy?
No. Accuracy is how close the reading is to the true value. Repeatability is how consistent the sensor is with itself. A sensor can be repeatable but consistently offset.
Does static accuracy include temperature drift?
No. Static accuracy is measured at room temperature. Temperature drift is a separate specification and is often the larger of the two. Convert drift figures to %FS/100°C before comparing datasheets.
What accuracy class do I actually need?
Match the sensor to your measurement chain. If the rest of the system cannot resolve 0.05% FS, a 0.05% sensor adds cost without adding information. For probe-level work, where weight matters as much as accuracy, see the UPT200 ultraminiature pressure transducer.
Get the Full Specifications
Every DABEY pressure sensor datasheet lists accuracy as a breakdown, not a single number. Non-linearity, hysteresis and repeatability are given separately, with the reference method stated.
Sales@dabeysensor.com · +86 188 9000 3683 · Download datasheets